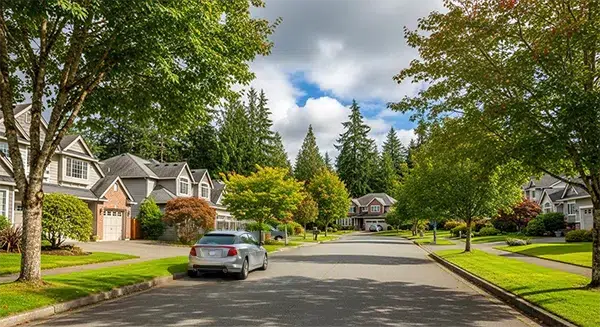
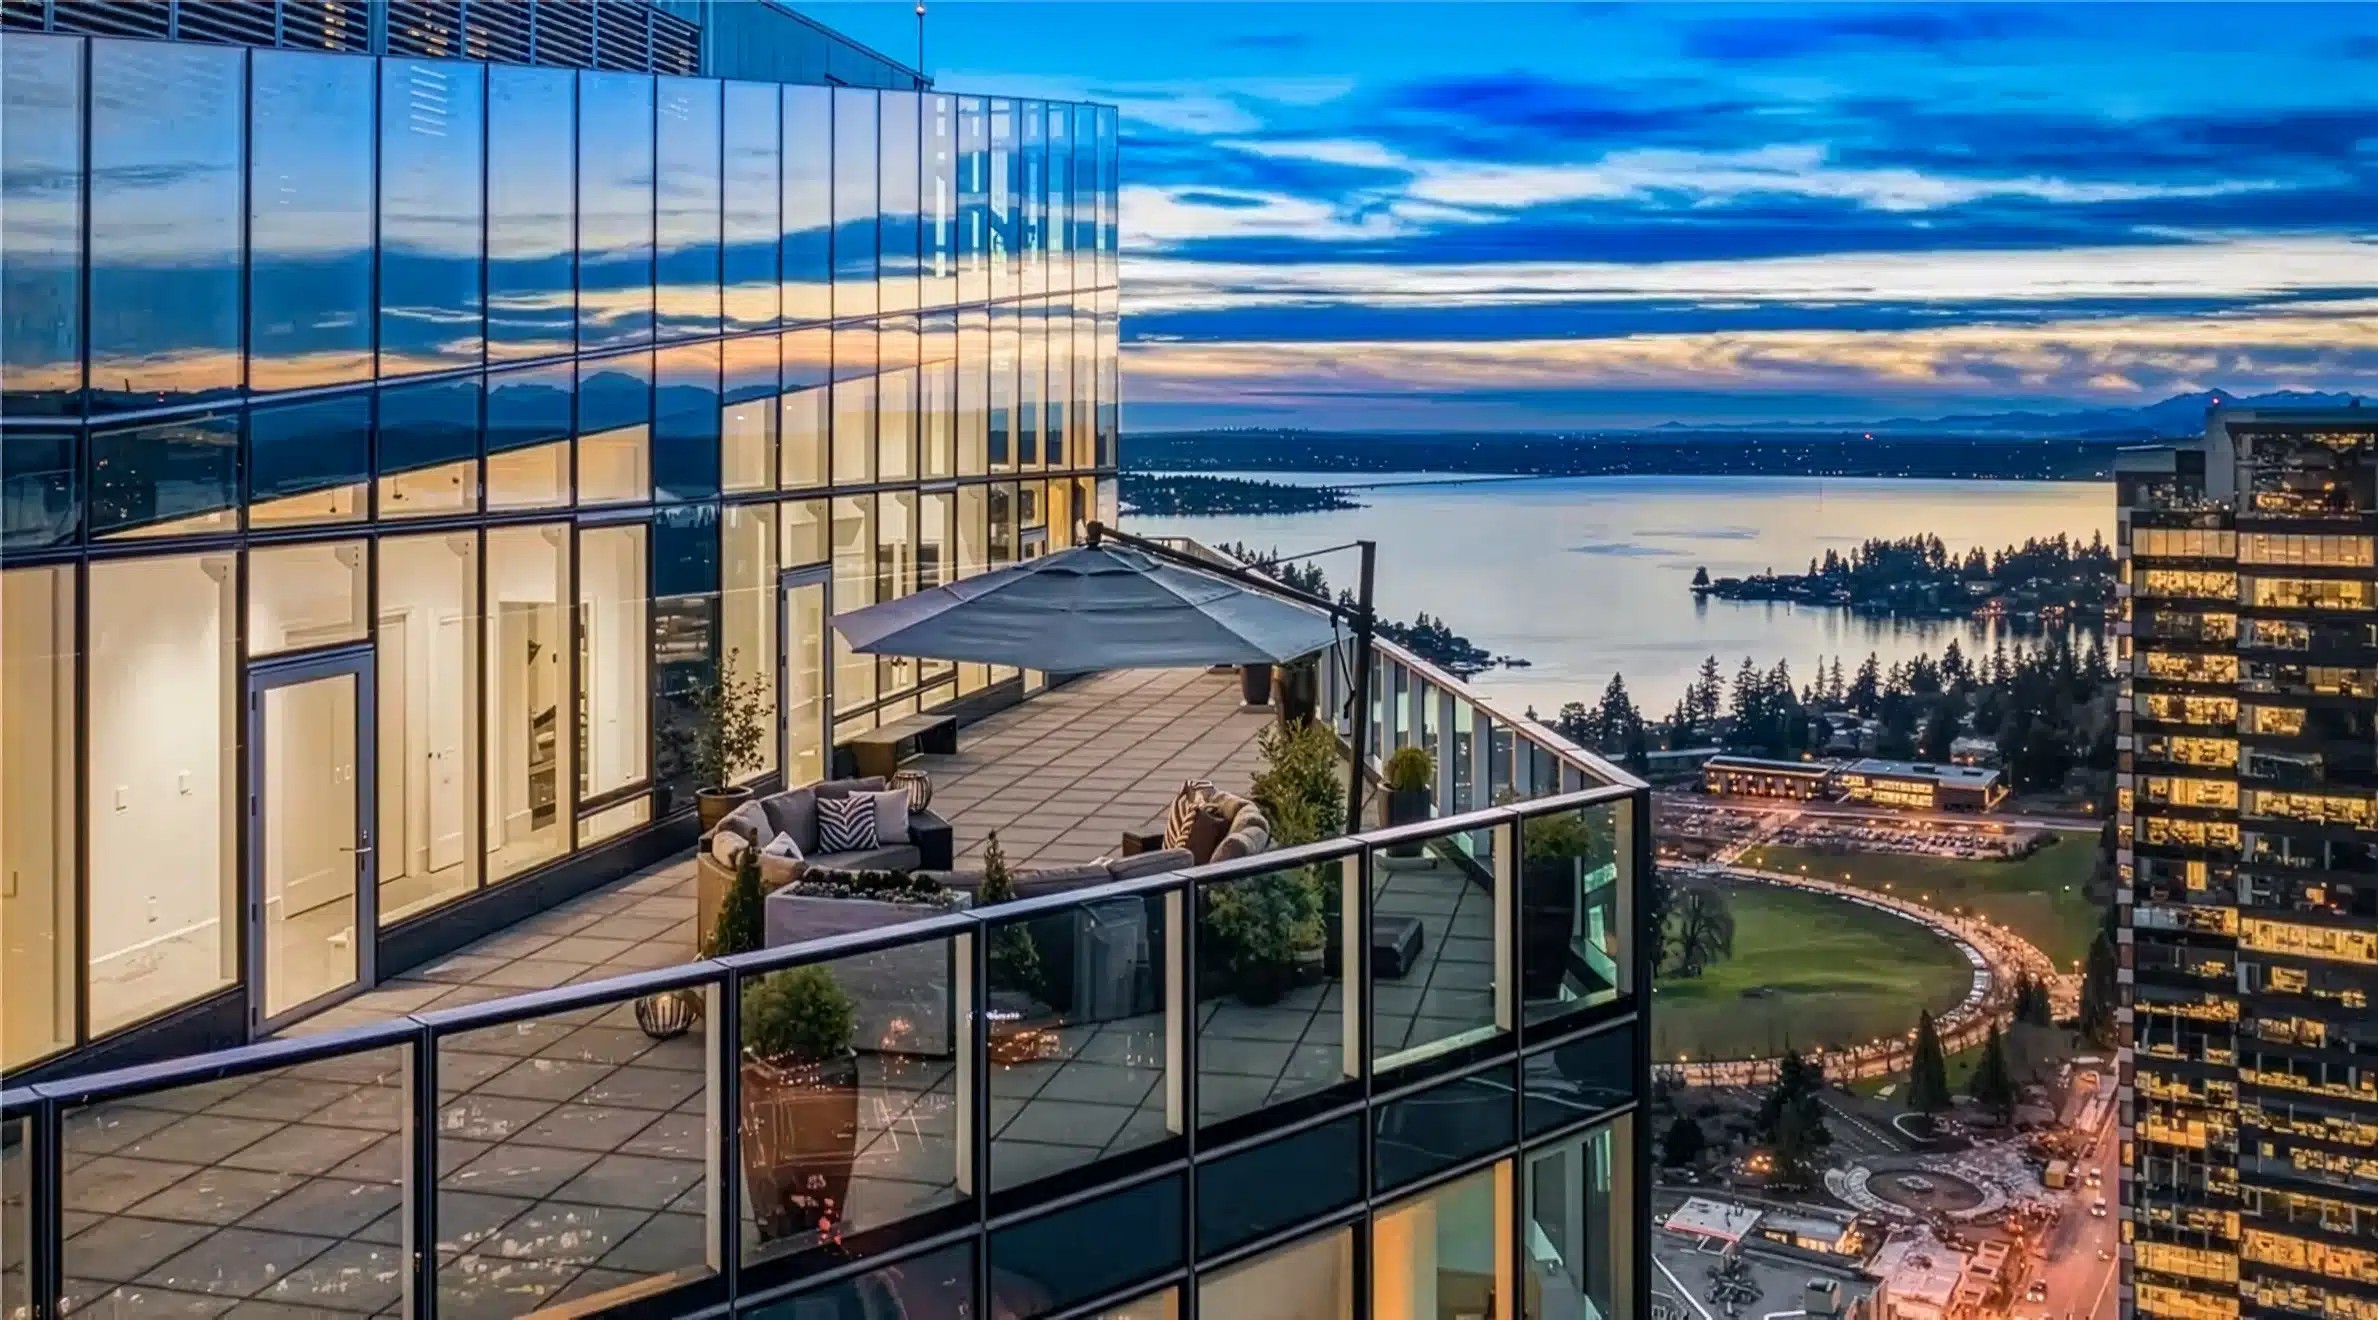
In one Redmond zip code, homes are still selling in five days. A few miles away, in the same city, a third of listings just took a price cut. Both of those things are true this month. I'm Mark Popach, a Redmond real estate agent at Popach & Co. I pulled the latest NWMLS, Freddie Mac, and Fannie Mae data to answer the question every Redmond seller is asking. Is now still a good time to sell, and what does 2027 look like?
What Redmond Home Prices Are Doing Right Now
Redmond's citywide median sold price runs between $1.25 million and $1.55 million, per NWMLS data from May through July 2026. That wide range is not a typo. Redmond is a small, luxury-heavy market, and a handful of high-end sales can swing the median month to month. Homes are selling in 14 to 26 days on average, and sellers are landing 97.9% to 98.2% of asking price. Months of supply sit near 4.1, up from about 2.6 in spring. That is real loosening, not a crash. For context, King County overall posted a median sold price near $860,000 to $880,000 over the same period, with homes moving in about 14 days. Redmond's median sits well above that county baseline.
Redmond Market Snapshot
| Metric | Figure | Source & Date |
|---|---|---|
| Median Sold Price | $1.25M – $1.55M | NWMLS, May–Jul 2026 |
| Months of Supply | 4.1 months | NWMLS, Jul 2026 |
| Median Days on Market | 14 – 26 days | NWMLS, May–Jul 2026 |
| Sale-to-List Ratio | 97.9% – 98.2% | NWMLS, May–Jul 2026 |
| 30-Year Fixed Mortgage Rate | 6.67% | Freddie Mac PMMS, August 13, 2026 |
Why Redmond Is Really Two Markets
The 98052 zip code around Microsoft's main campus barely slowed down. Homes there sell in 5 to 9 days, and the median runs $1.6 million to $1.7 million. Buyers describe it the same way agents do: fast and hot. Step outside that zip code and the picture changes fast. Close to a third of listings across the rest of Redmond have taken a price cut. Inventory is up, and sellers there are working with more competition than they had in spring. Pricing your home correctly means knowing which of these two markets you are actually in. A three-bedroom home near the Microsoft campus and one in Education Hill can post very different days-on-market numbers in the same week.
Redmond's Two Markets, Side by Side
| Metric | 98052 (Microsoft/Overlake) | Rest of Redmond |
|---|---|---|
| Median Sold Price | $1.6M – $1.7M | Blended citywide: $1.25M – $1.55M |
| Days on Market | 5 – 9 days | Up to 26 days |
| Market Condition | Fast, hot | ~33% of listings taking price cuts |
Source: NWMLS, May–July 2026.
Where Prices and Rates Are Headed Through 2027
Redmond's forecast depends on which side of Microsoft's campus you are on. My full Redmond market update projects the broader market continuing to favor buyers more than it did in spring. Inventory is running well above where it sat a few months ago. The 98052 pocket is unlikely to loosen the same way, since Microsoft employment drives demand there directly, not general market conditions. Rates will not do sellers many favors either. Fannie Mae's May 2026 forecast puts the 30-year fixed rate at 6.3% for the rest of 2026. That rate holds through early 2027, then eases only slightly, to 6.2%, in the second quarter. Sellers outside 98052 waiting for a rate cut to fix pricing will likely wait past 2027.
Is It a Good Time to Sell in Redmond?
Yes, if you price for the market you are actually in. Inside 98052, Redmond still behaves like a seller's market, with fast sales and strong pricing power. Outside it, sellers need today's comps, not spring's, to compete with rising inventory. A 97.9% to 98.2% sale-to-list ratio citywide shows real buyer demand still exists. The sellers stuck on the market right now are the ones pricing the whole city like it is still 98052. Buyers feel this split too. A buyer touring homes near the Microsoft campus meets multiple offers within days. A buyer looking a few miles out has room to negotiate and time to think.
Not sure which Redmond market you're really in?
Talk with me about pricing your home against your specific zip code, not the citywide average.
Why Pricing Precision Beats a Citywide Guess
Redmond rewards sellers who price precisely, not broadly. A listing priced for 98052 conditions in a slower pocket of the city will sit and take cuts. That is exactly what has happened to 33% of listings already. A listing priced too low inside 98052 leaves money on the table in a market still moving in days, not weeks. I build every Redmond listing's price around its specific zip code and neighborhood comps, then negotiate each offer against that data. That precision is what turns a split market into your advantage instead of your risk.
Why Waiting Rarely Pays Off in Either Redmond Market
Waiting only helps if conditions are about to turn in your favor, and nothing in the data points that way. Outside 98052, inventory has already climbed well past spring levels. Spring 2027 will bring its own fresh wave of new listings on top of whatever is still unsold. Mortgage rates are not projected to drop enough to pull hesitant buyers off the sidelines. Inside 98052, waiting carries a different risk. Today's 5 to 9 day sales are about as fast as this market gets. There is little upside to holding out for something better. Either way, the buyer pool you would face in 2027 looks a lot like the one you would face this fall.
The Redmond-Specific Details That Change Your Number
Redmond's neighborhoods do not move together, so your numbers depend on which one you are in. Education Hill, Grass Lawn, and Redmond Ridge each carry their own price band and buyer pool. All three sit apart from the Overlake and Microsoft-campus effect. Redmond Ridge sits farther from the office towers and typically sees a slower pace than 98052, closer to the citywide averages above. That effect matters if you are relocating for a Microsoft or Amazon role, or selling to someone who is. My breakdown of what relocating tech employees should know before buying covers commute patterns, school boundaries, and neighborhood tradeoffs that shape resale value. Getting the listing itself right matters just as much. My guide to what it takes to sell a home in Redmond covers pricing strategy and pre-listing preparation in detail.
Every seller's number changes once you factor in a specific zip code, condition, and timeline. Two homes a few blocks apart, one inside 98052 and one just outside it, can need completely different pricing strategies. I've closed more than $75 million in sales across the Eastside. That track record includes an average of 15 days on market, 83 client reviews, and an Agent's Choice Award. You can also browse active Redmond listings for sale right now. It is the fastest way to see what today's buyers in your zip code are choosing between.
Ready to find out what your Redmond home could sell for?
Talk with me about pricing, timing, and next steps before you list.
Market data sourced from NWMLS (May–July 2026), Freddie Mac Primary Mortgage Market Survey (August 13, 2026), and Fannie Mae Economic and Housing Forecast (May 2026). Figures reflect Redmond, WA listings and are subject to change as new data becomes available.